

Heads In, Hearts In: Photo-Graph
DOWNLOADMay 25, 2021 - MSU Extension
 Print
Print Email
EmailWhat you need to know:
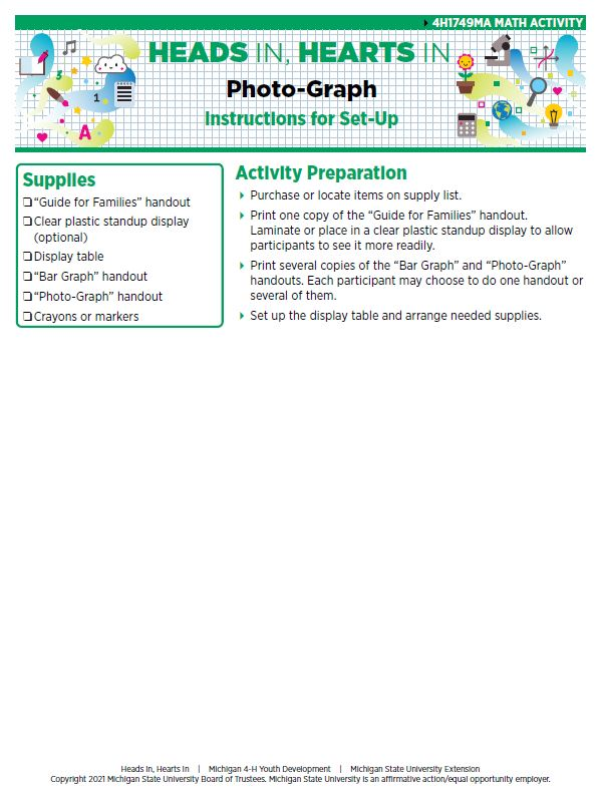
A graph is a way to show numbers in a chart or picture. A bar graph is used to show information in lines using columns and rows. A column is vertical or upright, and information is shown stacked on top of each other. A row is horizontal, and information is displayed in a left-to-right fashion or side by side.
What you will do and learn:
This activity will help you practice counting and grouping items and then displaying or graphing your results. In this activity, you will identify shapes, count the number of matching pictures, and then use a bar graph to display the results.
Other Documents in this Series
You Might Also Be Interested In
-
Celebrating 100 years of Michigan State University Extension in Alcona County
Published on October 19, 2017
-
Financial Manual for 4-H Volunteers
Published on August 1, 2024
-
Financial Manual for 4-H Treasurers
Published on August 1, 2024
-
Join 4-H!
Published on December 21, 2015
-
Michigan 4-H Foundation
Published on May 19, 2016
-
Impacts made in Clare County through Michigan State University Extension
Published on June 15, 2018


Accessibility Questions:
For questions about accessibility and/or if you need additional accommodations for a specific document, please send an email to ANR Communications & Marketing at anrcommunications@anr.msu.edu.